|
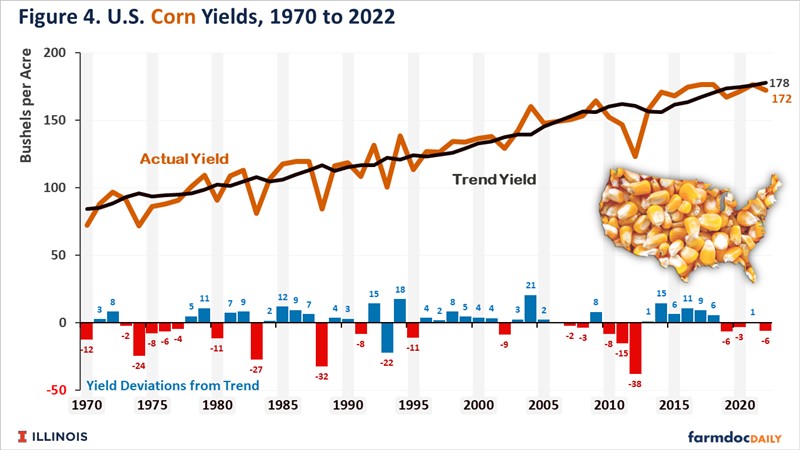
SE IL | It Would be helpful for everyone to take a look at it. To say a 150-160 type yield is as likely as a 185-190 is not supported by history. In the last 20 years 2012 is the only time we have been 20bpa or more below trend. 4 times we have had a yield that would be 190 or above. 4 times we have been 5+ bpa above trend which would be 8 of the last 20 years equaling 185 or above. Trend yield for this year I believe is right at 180, USDA always starts a little over it.
Edit to add: for perspective a 2004 type yield would be over 200 bpa national avg.
Edited by Deere6 5/24/2023 12:02
 (D66C7278-2D94-46A7-9455-BB45C0484172 (full).png) (D66C7278-2D94-46A7-9455-BB45C0484172 (full).png)
Attachments
----------------
 D66C7278-2D94-46A7-9455-BB45C0484172 (full).png (74KB - 65 downloads) D66C7278-2D94-46A7-9455-BB45C0484172 (full).png (74KB - 65 downloads)
| |
|
 IA & Tm trend line chart

