|
Fort Collins, CO | I apologize that it has taken me so long to respond. I've been considering the most effective way to answer this since the notification arrived Tuesday morning, and I wanted to be thorough. Here's my best go:
In your original question, you asked, "What's the best way to preserve $13.50 OC beans in the bin but keep upside wide open for 90-100 days." Given the downsloping nature of the forward curve in the futures market, that may not be possible if you can't lock in a particularly strong basis in your area through the end of August. As of the 05/26/23 close, September futures settled at $11.9850/bu - $1.3875/bu under the July futures price of $13.3725/bu. Since I'm not intimately familiar with your local bean basis, I will work through some examples using settlements from 05/26/23 for July futures and options. To be clear, these are just examples, not recommendations. Ideally, these examples give you a framework to evaluate different scenarios - meals for a lifetime and such.
Before we get into the examples, if you're committed to learning about options, you should pick up a copy of "Option Volatility & Pricing" by Sheldon Natenberg. It certainly isn't a Jack Carr page-turner. Still, it was the first book my bosses told me to read when I began my career in options just over twenty years ago - June 2nd, 2003, was my first day as an intern for a market-making firm on the floor of the Chicago Board Options Exchange. It's likely the first book I'll give to any green new hires at my firm. You can find a few other valuable selections on the website:
https://www.quartziteriskmanagement.com/rock-solid-reads
Some legal before we get into it:
None of what follows is specific trading advice; these are examples made with settlement prices from 05/26/23. None of this information is guaranteed to be accurate, tradable, or reliable. You should verify this information and consult a qualified advisor before making any financial decisions.
In the following examples, I will substitute a long futures position for grain in the bin to avoid muddying up the math with basis and other considerations (like interest). I will also leave out commissions because rates vary, and I want to keep the math clear.
Suppose for now that you're long 20 July 23 Soybean futures marked to the 05/26/23 settlement of 1337.25 cents/bu (Chart 1 below - in this and all other charts, the slopes shown extend beyond the scale shown on the charts). This position has linear (literally a straight line) risk. Let's also assume that you feel like having a potential $100k-ish loss down a buck is too much and that you want to "do something" about it, but you also want to "keep some upside." Of course, there are infinite possibilities in the modern marketplace that can vaguely accomplish both goals with varying degrees of effectiveness. There's no free lunch, however. In almost all scenarios, managing downside risk means giving up potential upside gains or substituting a different risk for the one you protect (if that weren't the case, there'd be free money out there for the taking, and generally speaking, there isn't). The key to effective risk management is often finding an efficient combination of tools that does the job effectively without compounding problems.
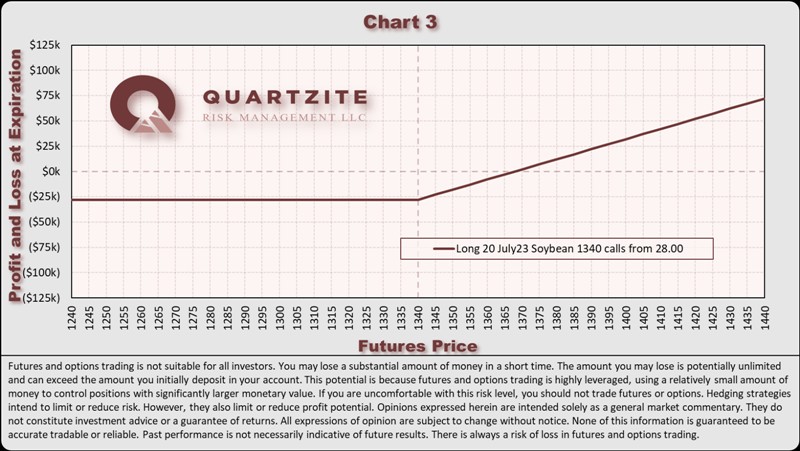
Let's add another assumption - you've heard somewhere along the way that the most "optiony" options for a given expiration are the at-the-money options, so you decide to work with those. You narrow it down to two choices - either pay 30.75 for 20 Jul 23 1340 puts to protect your existing futures position (Chart 2) or liquidate your futures position at 1337.25 and replace it by paying 28.00 for 20 Jul 23 1340 calls (Chart 3) to "keep yourself in the market." You'll notice you're now dealing with non-linear positions; their expiration profit and loss profiles bend at the strike (and are generally curved prior). That non-linearity comes at a price - the premium over parity (time value) of the options. If you're looking at Charts 2 & 3 and thinking I made a mistake because they're the same chart - I didn't. They're the same chart because they're synthetically the same thing.
Synthetic relationships are a curious aspect of the options market. Arbitraging (trading one versus the other) synthetics is one way that option market makers can (and do) make money trading against customer order flow. The most basic synthetic relationship for calls and puts with the same underlying asset, strike, and expiration is "+Underlying & +Put = +Call" and all the algebraic variations you can derive from it ("+P = +C & -U" or "+U & -C = -P" or "-U & -P = -C" or "+U = +C & -P" or "-U = -C & +P" etc.). There are many other important factors to consider (specifically, what's often known among traders as "carry"), and the number of synthetic relationships is nearly infinite. Covering this all is wildly beyond the scope of this post, and you should consider the data presented here as examples - not hard and fast rules. The Natenberg book mentioned above is an excellent resource for learning more about synthetic relationships and other helpful information.
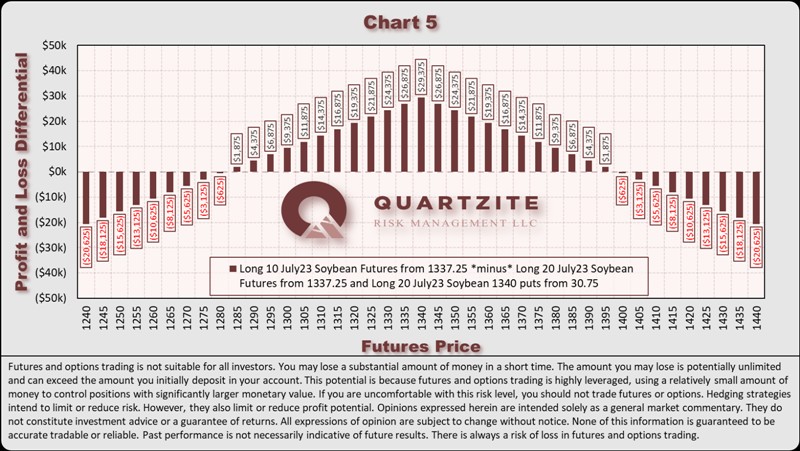
Let's assume that, armed with the above information; you want another alternative. You remember reading somewhere that at-the-money puts have a "delta" of roughly -0.5. Meaning if you buy them, you can expect them to perform similarly to approximately half of a short futures contract. You should only expect that performance right here, right now, as the effects of time decay, the supply and demand of options as a whole, underlying movement, and several other factors will also impact how they perform. Given all that info, you decide to soldier on and look at how simply holding half as many futures (10) would perform relative to maintaining the full futures position (20) with full put coverage. Chart 4 overlays the performance of both positions on top of each other at expiration. Chart 5 compares the relative performance of the two.
As you can see, they differ in performance in particular ways. The futures position covered by puts is better outside a given range, and the smaller futures position is better inside that range. This relative performance should match your intuition that positions that own options tend to do better in more volatile markets. It's also why in my original reply, I said:
"Adding options to a linear risk problem complicates what is otherwise a relatively simple picture. Arguably, unless you have a strong opinion about volatility, a good model and strategy for trading volatility, and the time to implement that strategy - you'd probably be just as well off to sell a delta-equivalent percentage of your physical roughly equal to whatever put you might buy."
Ultimately, I believe there are only a few good reasons to trade options. The first pair of those reasons stem from a risk management viewpoint. First, to solve a non-linear risk management problem. Second, to secure a relatively known cost for hedging (specifically to manage potential margin problems). Reasons three and four are speculative in origin. The third is that you disagree with the options market's expectations for volatility, and the fourth is that you disagree with the distribution of prices implied by the options market. Without one or more of those reasons and the proper knowledge, tools, and experience, I fear most folks are fishing in the dark alone.
Options are an incredibly complex topic, and even after 20 years of working with them professionally (and through some highly challenging markets and circumstances), I still often feel like I'm climbing my way up the second hill on the Dunning-Kruger curve and working toward the "Plateau of Sustainability." In that 20 years, I've seen many players come and go. Usually, the best ones are those willing to keep an open mind, do the work, and show up every day ready to learn. Luck is quite possibly the only shortcut.
 (20230604 AT Reply Chart 01 (full).png) (20230604 AT Reply Chart 01 (full).png)
 (20230604 AT Reply Chart 02 (full).png) (20230604 AT Reply Chart 02 (full).png)
 (20230604 AT Reply Chart 03 (full).png) (20230604 AT Reply Chart 03 (full).png)
 (20230604 AT Reply Chart 04 (full).png) (20230604 AT Reply Chart 04 (full).png)
 (20230604 AT Reply Chart 05 (full).png) (20230604 AT Reply Chart 05 (full).png)
Attachments
----------------
 20230604 AT Reply Chart 01 (full).png (104KB - 43 downloads) 20230604 AT Reply Chart 01 (full).png (104KB - 43 downloads)
20230604 AT Reply Chart 02 (full).png (107KB - 62 downloads)
20230604 AT Reply Chart 03 (full).png (106KB - 57 downloads)
20230604 AT Reply Chart 04 (full).png (110KB - 44 downloads)
20230604 AT Reply Chart 05 (full).png (125KB - 56 downloads)
| |
|
 Weekly Corn Market Update & ask me anything

