| As in this daily array here...as each day passes one drops off and another shown. We focus on the top line of the array for turning points...looking for the highest blue bar and the smallest pink bar for the turn dates. So it depends on how the market is moving in the cycles of highs and lows...Example in corn it has been shifting almost daily for the last few sessions, where as this cattle array here shown, they may not change for a week or more on a daily basis, you don't know if the next day before a turn date could change if the next bar coming into view has a lower or higher pink or blue bar. kinda confusing but once you start watching, it will click.
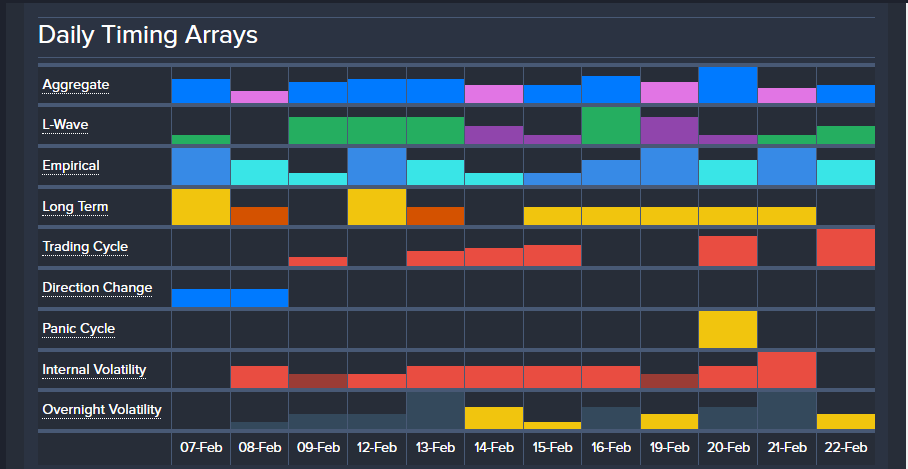 |
 Cattle

