|
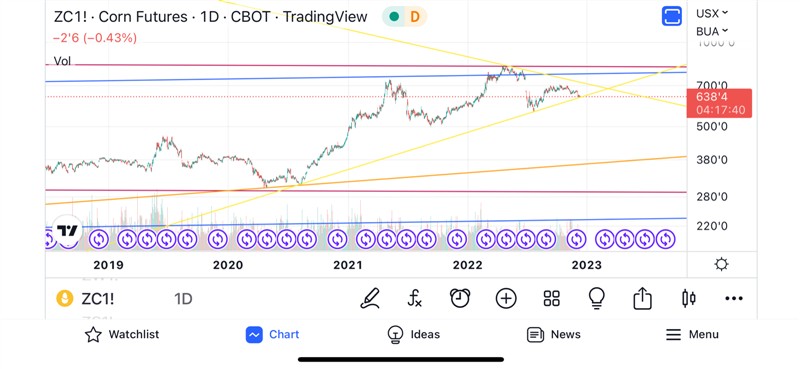
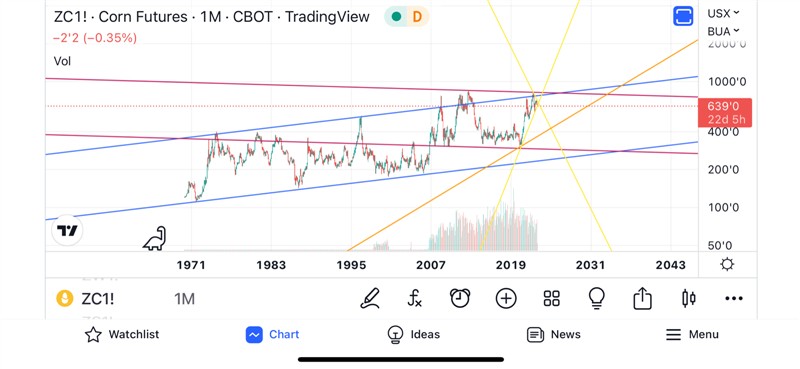
| I think it’ll rally here. I’m posting a Smaller time frame chart. And a longer time frame chart. In the longer one I think the yellow lines can be ignored because they are shorter term trend lines The orange line might worry me tho. It looks like lines are all over the place but it’s really just two channel. The red is The downward channel obviously and blue upward. By no means are these definitive. It just some lines I eyeballed to show potential or possible trends.
Edited by Deltamudd 12/8/2022 09:13
 (D2808B08-57ED-4EF1-9C3D-35AED517BEA7 (full).png) (D2808B08-57ED-4EF1-9C3D-35AED517BEA7 (full).png)
 (8E465141-416F-4913-A9CA-5ACE5B5935A9 (full).png) (8E465141-416F-4913-A9CA-5ACE5B5935A9 (full).png)
 (FAF48BF7-825F-4449-B4D4-1BFE3DA52D16 (full).jpeg) (FAF48BF7-825F-4449-B4D4-1BFE3DA52D16 (full).jpeg)
Attachments
----------------
 D2808B08-57ED-4EF1-9C3D-35AED517BEA7 (full).png (63KB - 241 downloads) D2808B08-57ED-4EF1-9C3D-35AED517BEA7 (full).png (63KB - 241 downloads)
8E465141-416F-4913-A9CA-5ACE5B5935A9 (full).png (55KB - 216 downloads)
FAF48BF7-825F-4449-B4D4-1BFE3DA52D16 (full).jpeg (68KB - 199 downloads)
| |
|
 Corn
Corn

